
| Research History |
| Software Structure |
| Specie Sensitivity Distribution |
| BAYESIAN Inference |
| MCMC Simulation |
| DIC Optimization |
| Ecorisk & Uncertainty |
| Joint Probability Curve |
| Exergy SSD |
| Main Function Lists Panel |
| BMC-SSD Panel |
| Models Optimization Panel |
| JPC Panel |
| ExSSD Panel |
| Work Path & Output Results |
| Installation & Initialization |
| Folder & File Extraction |
| SSD Models & Ecorisk |
| JPC & Its Indicators |
| Models Optimization & Parameters |
| ExSSD Models & ExEcorisk |
Links
| College of Urban and Environment Science |
| Peking University |
Models Optimization & Parameters
The SSD curve based on Exergy theory is the premise to assess the risks of ecosystem. Before entering the “ExSSD” interface, the toxicity data of chemicals at different trophic levels should be optimized and organized. To distinguish different trophic levels, the toxicity data of chemicals should be named as “name+_1” or “name+TL1”. Then use the “Batch SSD” module to organize the data. Figure 21 shows the steps:
(1) Click “Load”, and select the folder where the SSD models are, such as “Output”.
(2) Click “Loaf”, and select the output path, which is “Output” by default, or you can generate a new folder to distinguish from the folder containing the SSD models.
(3) Click “Best Model”, and the file of parameters and the best model for chemical will be generated in output path (see Figure 13).
(4) Click “Parameters”, and the file of parameter results will be generated in output path (see Figure 13). But this file doesn’t contain the best model information. If current study just involves single model, step (3) can be skipped.
(5) The information screen will show the status of each process.
(6) Please reset all the information in the interface before a new run.
(7) Please click “Back to BMC” button to jump to single-run-BMC interface.
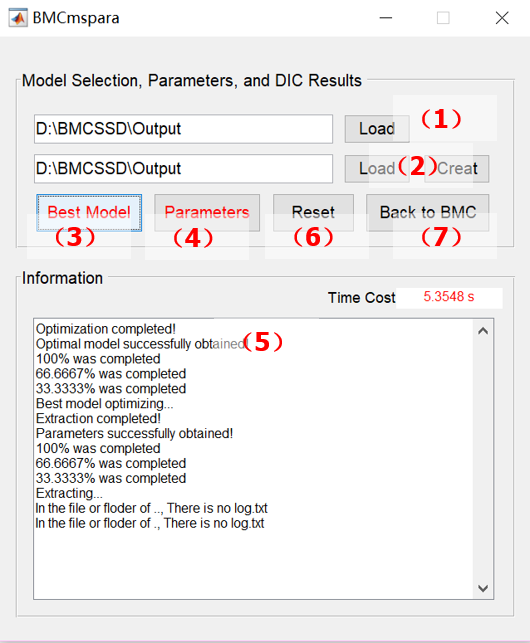
Figure 21 Optimization process of SSD models
![]()