| Research History |
| Software Structure |
| Specie Sensitivity Distribution |
| BAYESIAN Inference |
| MCMC Simulation |
| DIC Optimization |
| Ecorisk & Uncertainty |
| Joint Probability Curve |
| Exergy SSD |
| Main Function Lists Panel |
| BMC-SSD Panel |
| Models Optimization Panel |
| JPC Panel |
| ExSSD Panel |
| Work Path & Output Results |
| Installation & Initialization |
| Folder & File Extraction |
| SSD Models & Ecorisk |
| JPC & Its Indicators |
| Models Optimization & Parameters |
| ExSSD Models & ExEcorisk |
Links
| College of Urban and Environment Science |
| Peking University |
JPC Panel
1. Single-step run panel
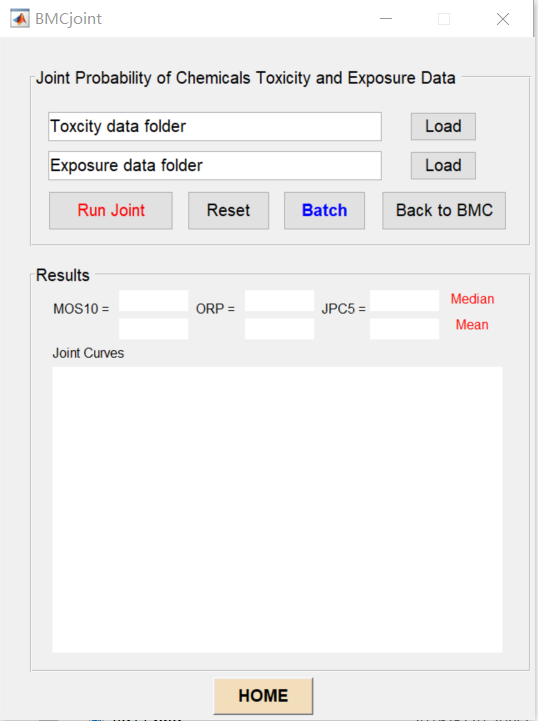
The joint probability curve single-step run panel is composed of two parts, data input and result representation, as shown in Figure 10.
Import the toxicity data folder and the exposure data folder. Click "Run" to complete the construction of the joint probability curve, which is built based on the mean and median of the posterior distribution of SSDs parameters. Click the "Batch" button to switch to the "Joint probability curve batch run panel".
Assessment indexes like "Joint probability curve", "MOS10", "ORP", and "JCP5" are in "Results". All the indexes, which are used to determine the mean and median of the posterior distribution of SSDs parameters, are also displayed in this area.
In this function panel, all the information about data input and result output on the screen can be reset via the "Reset" button. You can switch to the other function panels by the "Return to BMC" button.

Figure 10 JCP single-step run panel
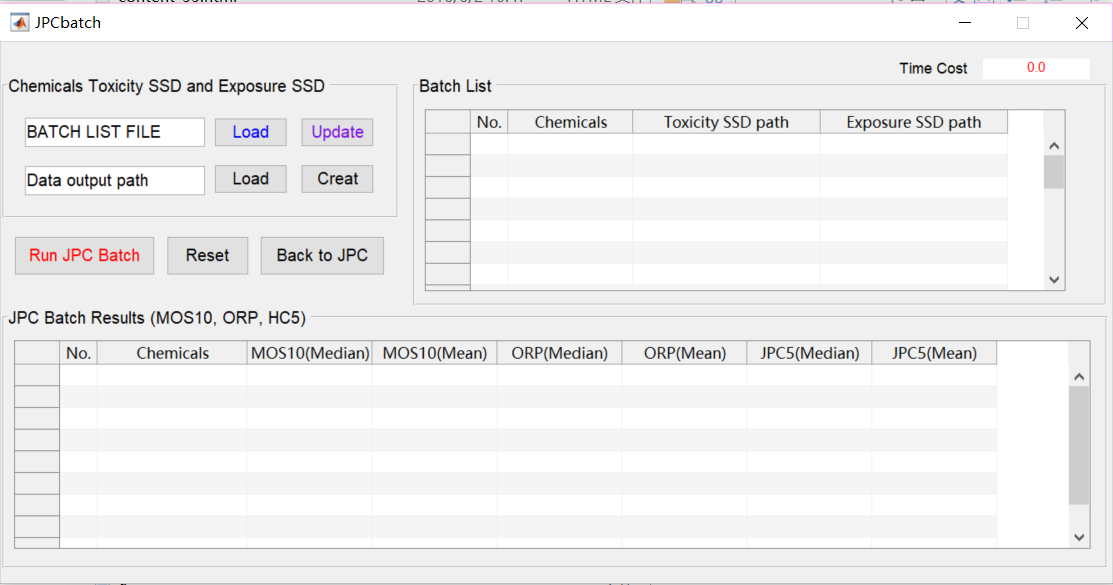
2. Batch run panel
Joint probability curve batch run panel is composed of " Chemicals Toxicity SSD and Exposure SSD", "Batch List", and " JPC Batch Results (MOS10, ORP, JPC5)", as shown in Figure 11. Import the "Batch list" and " Data output path” separately in "Chemicals Toxicity SSD and Exposure SSD”. If you need to modify the data in the "Batch List" on the right side, click the "Update" button to update newly entered batch lists. You can either use the default output path “Output”, or "Create" a folder composed of "Output + Time". After "Run JPC batch", assessment indexes like the NOS10, ORP and JPC5 of different pollutants will be displayed in " JPC Batch Results (MOS10, ORP, JPC5)". In this function panel, all the information about data input and result output on the screen can be reset via the "Reset" button. You can switch to the other function panels by the "Return to JPC" button.

Figure 11 JPC batch run panel
![]()