
| Research History |
| Software Structure |
| Specie Sensitivity Distribution |
| BAYESIAN Inference |
| MCMC Simulation |
| DIC Optimization |
| Ecorisk & Uncertainty |
| Joint Probability Curve |
| Exergy SSD |
| Main Function Lists Panel |
| BMC-SSD Panel |
| Models Optimization Panel |
| JPC Panel |
| ExSSD Panel |
| Work Path & Output Results |
| Installation & Initialization |
| Folder & File Extraction |
| SSD Models & Ecorisk |
| JPC & Its Indicators |
| Models Optimization & Parameters |
| ExSSD Models & ExEcorisk |
Links
| College of Urban and Environment Science |
| Peking University |
Folder & File Extraction
BMCSSD can run multiple models with various contaminants in batch. When the BMC-SSD or joint probability curve runs in batch, the BMC batch list and JPC batch list (Figure 14) are reqiured.
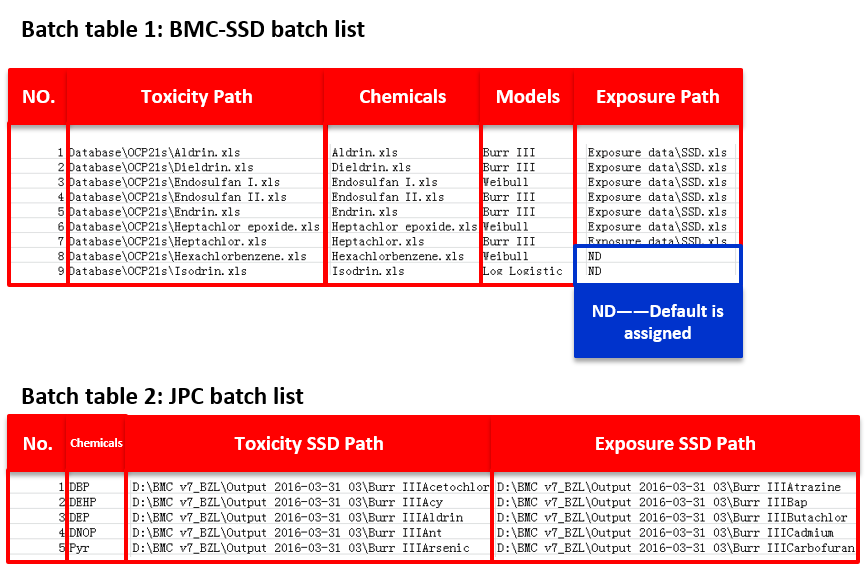
Figure 14 Two batch lists for SSD and JPC of BMC-SSD
The most important information in these lists are the paths of the files and the folders. Please click “Extract File Name List” in the Main Function List Panel, and a window showing “browse the folders” displays in Figure 15. Then select the folder where the target files are, such as “Database”, and the information extraction is started . After the extraction, an excel file with the name “a name list + current time” will be created in the main working directory. This file will include the file paths and the file names. Users can select the target compounds and copy the information into the BMC batch list.
Please click “Extract Folder Name List” in the Main Function List Panel, and a window showing “browse the folders” displays in Figure 15. Then select the folder where the target folders are, such as “Output”, and the information extraction is started. After the extraction, an excel file with the name “a Folder list + current time” will be created in the main working directory. This file will include the folder paths and the folder names. Users can select the target SSD model and copy the information into the JPC batch list.
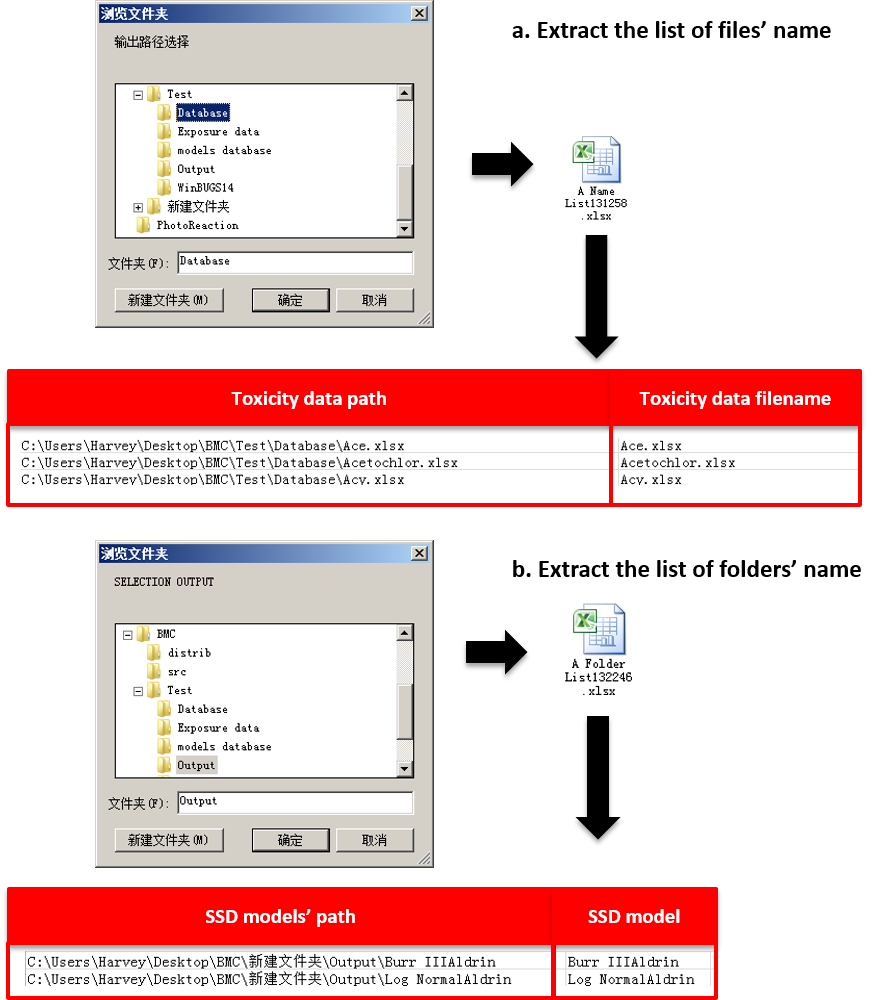
Figure 15 The extract methods for files and folders
When we construct the SSD curves by using BMC-SSD, the most toxicity data are mainly from EPA ECOTOX database. So this software provides a small feature to organize the automatically generated sheet from EPA ECOTOX database. Please click “Extract Toxicity” in the Main Function List Panel, and a dialog box, namely, ColSelec, showing Figure 16. Then, fill in the table with the corresponding column number in the data from ECOTOX after loading the data by clicking “Load Data” Select the folder where the EPA ECOTOX files are (note: all the EPA ECOTOX data should be saved in the same folder, without other excel files. For example, generate a “EPA” folder inside “Database” directory, then copy the “AquireReport (Li,In,Ag,Tl,Ga).xls” into this folder). Click “OK”, and the information extraction is started. After the extraction, an excel file with the name “ecodatbase + current date and time” will be generated in the main working directory. These concentration data should be organized in a unified unit, typically microgram per liter (μg/L). Then delete the unit column, and combine the similar compounds, such as the compounds with same metal ions. Then click “Classify Toxicity” button. Select the organized ecodatbase file (.xlsx), and the ecotoxicity data classification starts. After the classification, a folder, containing the toxicity data files with a name “toxdata+date and time”, will be generated inside the “Database” directory. (Figure 16)
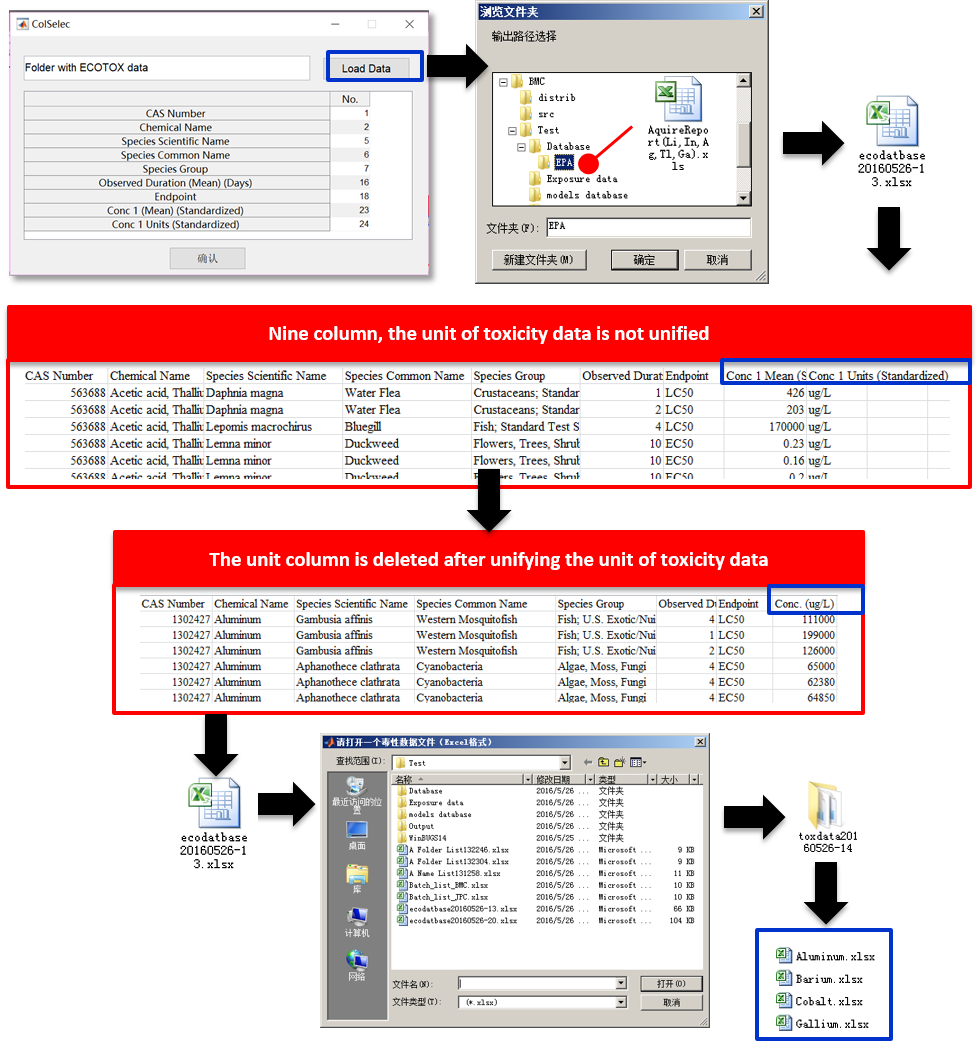
Figure 16 Extraction of toxicity data from EPA ECOTOX database
![]()