
| Research History |
| Software Structure |
| Specie Sensitivity Distribution |
| BAYESIAN Inference |
| MCMC Simulation |
| DIC Optimization |
| Ecorisk & Uncertainty |
| Joint Probability Curve |
| Exergy SSD |
| Main Function Lists Panel |
| BMC-SSD Panel |
| Models Optimization Panel |
| JPC Panel |
| ExSSD Panel |
| Work Path & Output Results |
| Installation & Initialization |
| Folder & File Extraction |
| SSD Models & Ecorisk |
| JPC & Its Indicators |
| Models Optimization & Parameters |
| ExSSD Models & ExEcorisk |
Links
| College of Urban and Environment Science |
| Peking University |
ExSSD Panel
System-level ecological risk assessment panel is composed of "Exergy SSD - Data I/O Setting", "K-value Setting", "K-value posterior distribution" and "ExSSD curves with uncertainty", as shown in Figure 12.
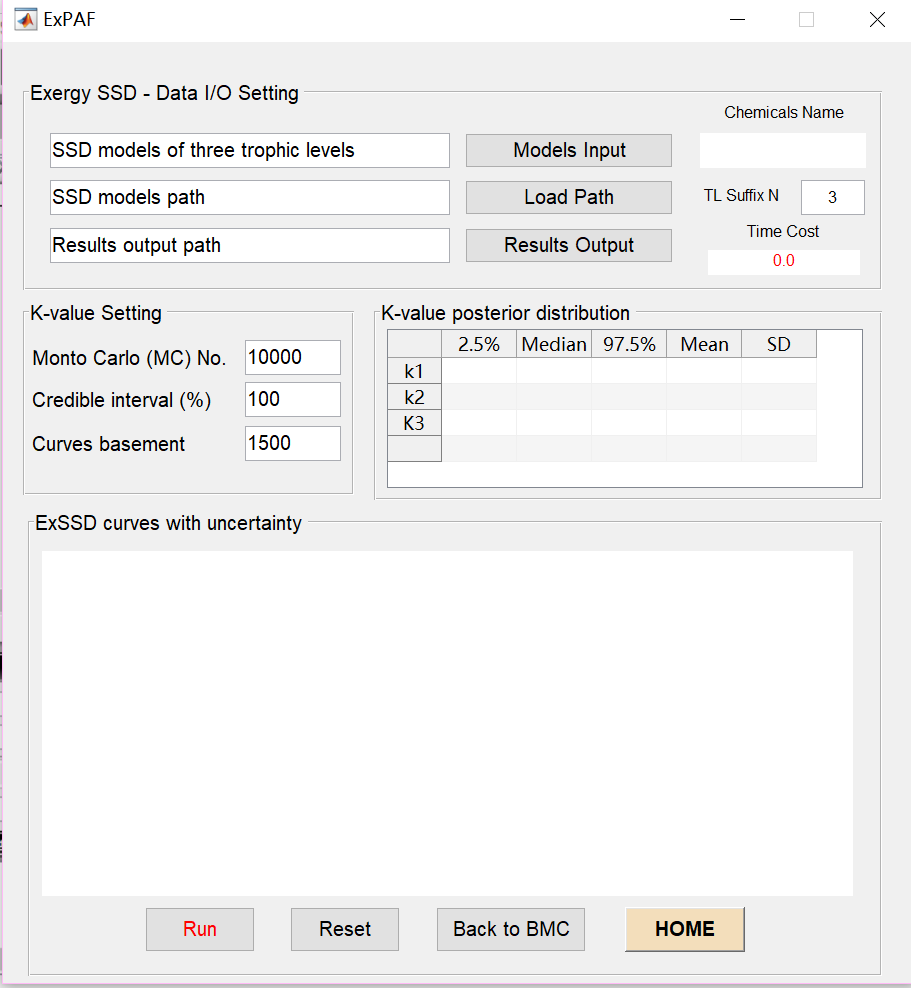
Figure 12 System-level ecological risk assessment panel
In "Exergy SSD - Data I/O Setting ", input the “three SSD models at different trophic levels (Excel format)” and the "SSD model path" at three different trophic levels, with the default path being “Output”. Set the "Result output path". You can either use the default path “Expafoutput”, or select your own path. Since "_1" or "TL1" is used to differentiate the different trophic level of the same compound, our software will remove the suffix based on number of Suffix characters in order to extract the names of pollutants. Chemicals that are used for risk assessment at system-level will be displayed in “Chemical Names”.
You can set the following parts in "K-value Setting ": “Monte Carlo (MC) No.”, the boundary parameters selected from a "Credible interval" of Wi and bi SSDs, the "Curves basement". The last one is interpolated between parameter boundaries, in order to build the random library of Wi and bi. Statistics such as 2.5% percentile, median (50% percentile), 97.5% percentile, mean and standard deviation of the K value can be found in "K-value posterior distribution ". The probability distribution curve of tropical-level weight k1, k2 and k3 and the ExSSD diagram with uncertainty boundary (containing three different trophic levels SSDs) is displayed in "ExSSD curves with uncertainty" main display different trophic levels weights k1, k2, and k3 of the with uncertainty and ExSSD boundary. In this function panel, all the information about data input and result output on the screen can be reset via the "Reset" button. You can switch to the other function panels by “HOME” and "Return to BMC" button.
![]()