
| Research History |
| Software Structure |
| Specie Sensitivity Distribution |
| BAYESIAN Inference |
| MCMC Simulation |
| DIC Optimization |
| Ecorisk & Uncertainty |
| Joint Probability Curve |
| Exergy SSD |
| Main Function Lists Panel |
| BMC-SSD Panel |
| Models Optimization Panel |
| JPC Panel |
| ExSSD Panel |
| Work Path & Output Results |
| Installation & Initialization |
| Folder & File Extraction |
| SSD Models & Ecorisk |
| JPC & Its Indicators |
| Models Optimization & Parameters |
| ExSSD Models & ExEcorisk |
Links
| College of Urban and Environment Science |
| Peking University |
Joint Probability Curve
Joint probability curve combines the distribution patterns of both toxicity and exposure data, so it reflects the species-environment relationship (Solomon et al., 2000). After obtaining the distribution patterns of toxicity and exposure data sets by SSD curve establishment function in our BMC-SSD software, the exposure and effect distribution are put in a same coordinate system to build the joint probability curve with their vertical ordinate data. As shown in Figure 3, the x-axis of JPC is set to be the vertical ordinate values of effect distribution, which means p% species are affected, and the y-axis is set to be 1- vertical ordinate values of exposure distribution, which means the fraction of the exposure concentration in the total environment when p% species are affected.
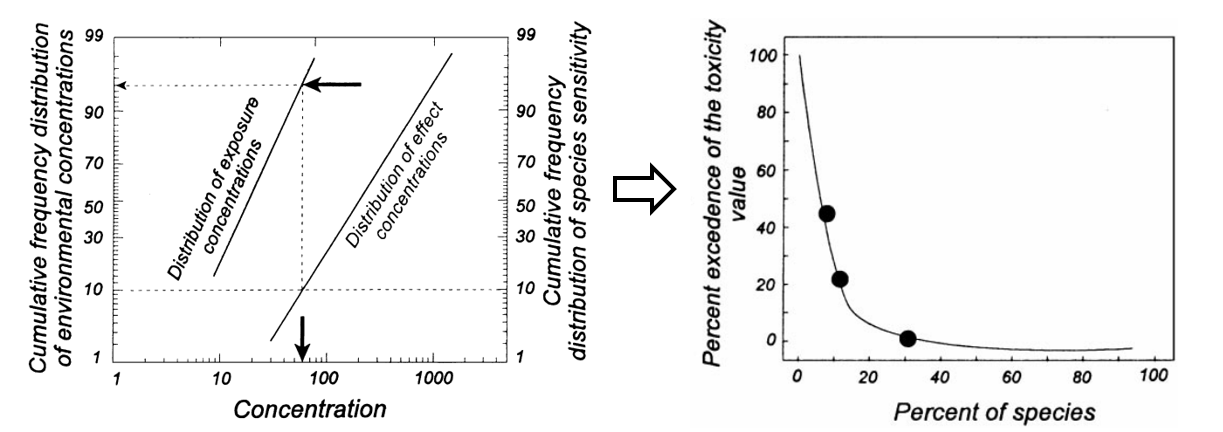
Figure 3 JPC models (relationship between exposure data and species) (Modified from Solomon et al. (2000))
Figure 4 shows the connotation of different shapes of JPCs, unlike species survival curve, the eco-risk of a certain contaminate goes up along the diagonal direction (from convex JPCs to concave JPCs). That is to say, the contaminates with convex JPCs have lower eco-risks while the those with concave JPCs have higher eco-risks. The exact risk values, defined as Overall risk probability (ORP), can be calculated as the integral of JPCs by our BMC-SSD software. Generally, the higher ORP values are, the bigger eco-risks are. Other indexes in eco-risk assessment like JPC5 (the fraction of the exposure concentration in the total environment when which 5% species are affected) and MOS10 (the ratio of 10% of concentration of toxicity cumulative distribution curve with 90% of concentration of exposure cumulative distribution curve) can also be obtained by the JPCs in our software.
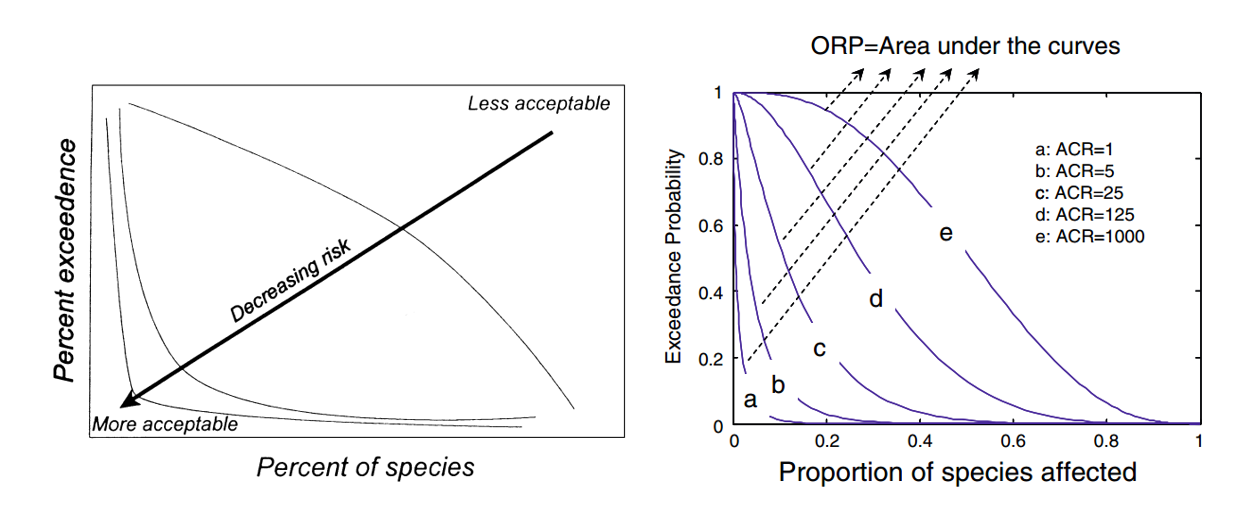
Figure 4 Meanings of JPC and ORP (modified from Solomon et al. (2000) and Wang et al. (2009))
![]()